


The doctor will assess your child’s growth at every visit. During the first two years of your child’s life, the pediatrician will evaluate his/her length, weight, and head circumference (the distance around his/her head at its widest point).
When your kiddo reaches 2 years of age, the doctor will stop measuring his/her head circumference, and start measuring his/her BMI (body mass index). BMI estimates a child’s body fat in terms of his/her height and weight. This measurement helps determine whether the child is underweight, at a healthy weight, or is overweight for his/her age.
The above measurements are then plotted on your child’s growth chart. The growth chart gives the doctor a sense of how your child is growing compared to other kids his/her age and sex.
Below, We’ll Discuss:
Let’s Start Off By Talking About the Two Most Commonly Used Types of Growth Charts. They Are:
1. The Centers for Disease Control and Prevention (CDC) Growth Chart.
2. The World Health Organization (WHO) Growth Chart.
What’s the Difference Between These Two Growth Charts?
- The CDC growth chart only looks at children in the United States, whereas the WHO growth chart compares children across the world.
- In addition, the CDC publishes growth charts for kids up to age 18, whereas the WHO growth chart only goes up to age 5.
So, Which Growth Chart Do Doctors Use?
The CDC itself recommends that health care providers in the U.S. use the WHO growth chart for the first 2 years of life and the CDC growth chart for kids 2 years and older.1
A Quick Heads Up:
- Kids in the U.S. tend to be fatter and shorter (on average) than their peers abroad.
- Because of this, children often experience an artificial drop in their growth percentiles at age 2, when they’re switched from the WHO growth chart (which compares them to kids around the world, including to malnourished children in developing countries) to the CDC growth chart (which only looks at children in the U.S.).
In this case, the dip in percentiles is because of the switch to the CDC growth chart, not because of a change in the child’s growth rate.
Insider Info: Some doctors in the U.S. use the CDC growth chart the whole way through (from birth until adulthood) to avoid this issue.
PediaTip: Ask your child’s pediatrician which growth chart(s) he/she uses.
Specialized Growth Charts:
In addition to the CDC and WHO growth charts, there are specialized growth charts for kids who were born prematurely and for those with Down syndrome, hypothyroidism, and Turner’s syndrome (to name a few). Premature babies typically switch from the premature growth chart (aka the Fenton Growth Chart) to the standard growth chart at 2 years of age (corrected).
Common Question: How Do Doctors Create Growth Charts?

Most doctors use electronic medical records that automatically plug their patients’ measurements into the growth chart. Before practices went paperless, the growth charts were done by hand.
If You Measure Your Child at Home and Want to Know Where He/She Falls on the Growth Chart, You Can Either:
1. Print out the growth chart (Google the one you want) and plot the measurements by hand.
OR
2. Go online and use the CDC growth chart calculator, which does all of the math and plotting for you.
PediaTip: There will be some natural variation between your home scale and the scale at the doctor’s office. Therefore, use your home measurements to obtain a ballpark figure and the doctor’s measurements to officially track your child’s growth.
Below are the CDC Growth Chart Templates for Kids Zero to 3 Years (36 months) of Age.
The first chart is for boys and the second chart is for girls.
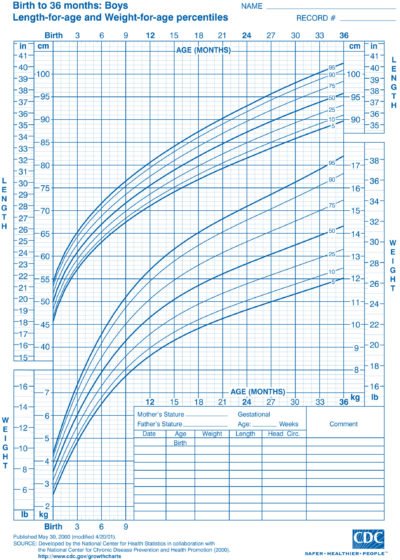
Image Source: CDC
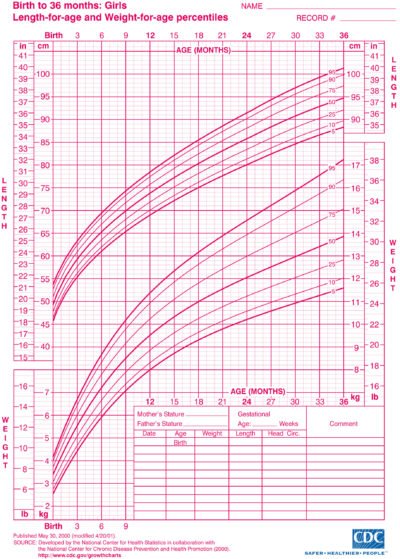
Image Source: CDC
To plot your child’s growth by hand, find his/her age (in months) on the x-axis and his/her weight or length on the y-axis, then draw a dot where the values intersect.
How Do Doctor’s Interpret Growth Charts?
The pediatrician will probably throw a bunch of percentiles at you when discussing your child’s growth chart.
But What Do They Mean? The percentiles make a comparison between your child’s growth and that of other children who are the SAME age and sex.
Here Are Some Examples:
1. DocTalk: The doctor tells you that your 4-month-old son is at the 50th percentile for weight on the CDC growth chart for boys 0-36 months.
Intepretation: This means that half of all male 4-month-olds in the U.S. (with the same birthday) weigh more than him, while the other half weigh less.
2. DocTalk: The doctor mentions that your 2-year-old daughter is at the 75th percentile for length on the CDC growth chart for girls 0-36 months.
Interpretation: This means that your daughter is longer than 75% of 2-year-old girls (with her birthday) in the U.S., and shorter than 25% of them.
Reality Check: Your child’s growth percentiles are not like a grade on a math test. Higher doesn’t necessarily mean better. Instead, focus on whether your child is following his/her own curve. If so, then his/her rate of growth is on track.
What If My Child Is “Falling Off His/Her Curve” (i.e. Not Growing Appropriately)?
If your child is below the 3rd percentile for height or weight OR his/her curve has crossed 2 major percentile lines in the downward direction (for example, his/her height went from the 75th percentile to the 25th percentile), then he/she may be diagnosed with “failure to thrive.” In this case, the doctor will ask you a bunch of questions and may run a few tests to determine the cause of the poor growth and how to treat it.
Get Wise about Failure to Thrive and How it’s Managed, here.
Reality Check: It can take a little while for babies to find their “true” growth curve. This means that a baby may start out “big” but end up at a lower percentile because of genetics (or vice versa). Doctors, therefore, take parent size into account when evaluating growth charts.
A Word of Advice: It’s natural for parents to compare their kids’ size to that of other children. However, try not to fall into this comparison trap for 2 reasons:
1. Everyone grows at his/her own pace.
2. These types of comparisons are not accurate. If comparison is what you’re going for, your child needs to be compared to other children of the same sex with the exact same birthday across a large population. That’s the magic of the growth chart!
The Bottom Line
The doctor will measure your baby at every visit and plot his/her measurements on the growth chart. This will give both you AND the pediatrician an objective view of how your baby is growing.